
Fig. 3.
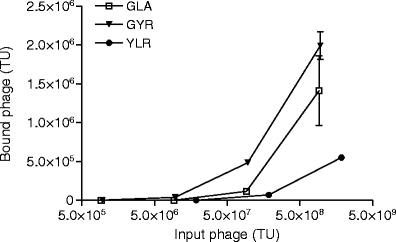
Dose-response curve of phage GLA, GYR and control phage YLR. Mean±S.D., n = 2. One way ANOVA after log transformation to correct for non-Gaussian distributions with Dunnet’s correction for multiple comparisons against control. GLA and GYR vs YLR p < 0.01. AUC is 14× and 26× higher for GLA and GYR, respectively.