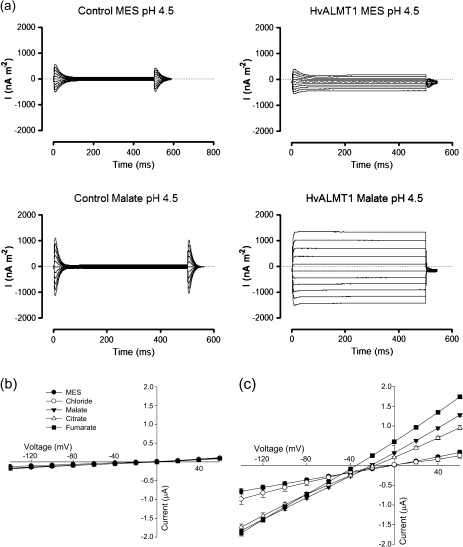
Fig. 4.
Electrophysiology of Xenopus oocytes expressing HvALMT1. (a) Family of current curves measured in Xenopus laevis oocytes injected with water (control) or HvALMT1 cRNA in response to 500 ms voltage pulses between –140 mV and 60 mV in 20 mV steps. The data were collected with either 10 mM MES–BTP or 10 mM malate–BTP in the bathing solution (pH 4.5). Current–voltage curves generated from the currents measured in control oocytes (b) or HvALMT1-expressing oocytes (c) with different anions in the bathing solution. Currents were recorded from oocytes incubated in MES–BTP (MES), chloride–BTP (Chloride), malate–BTP (Malate), citrate–BTP (Citrate), or fumarate–BTP (Fumarate) at pH 4.5. Error bars show the SEM, n=6.

