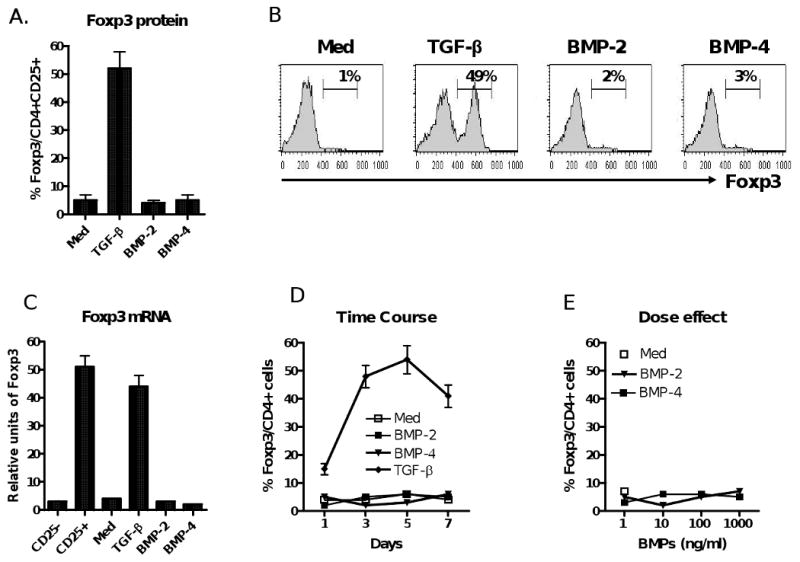
Figure 1.

BMP-2 and BMP-4 fail to induce Foxp3 expression on CD4+ cells. (A) Splenic naive CD4+CD25- cells isolated from C57BL/6 mice were stimulated with anti-CD3/CD28 coated beads (1:5) in the presence of IL-2 (20 u/ml) and TGF-β (2 ng/ml), or BMP-2 (10 ng/ml), or BMP-4 (10 ng/ml) for 4 days. Intracellular Foxp3 protein expression was analyzed by flow cytometry. Data show mean ± SEM of five independent experiments. (B) Representative histogram of experiments described in panel (A). The percentage of CD25+ cells expressing Foxp3 is shown in the upper right of the histogram. (C) Foxp3 mRNA expression as determined by real time PCR after normalization of β-actin. Data show mean ± SEM of four independent experiments. (D) Foxp3 and CD25 expression over time using a similar experimental design as in A. (E) Dose effect of BMP-2 and BMP-4 on the induction of Foxp3 expression. Data from panel D and E show mean ± SEM of four independent experiments.
