
Figure 4.
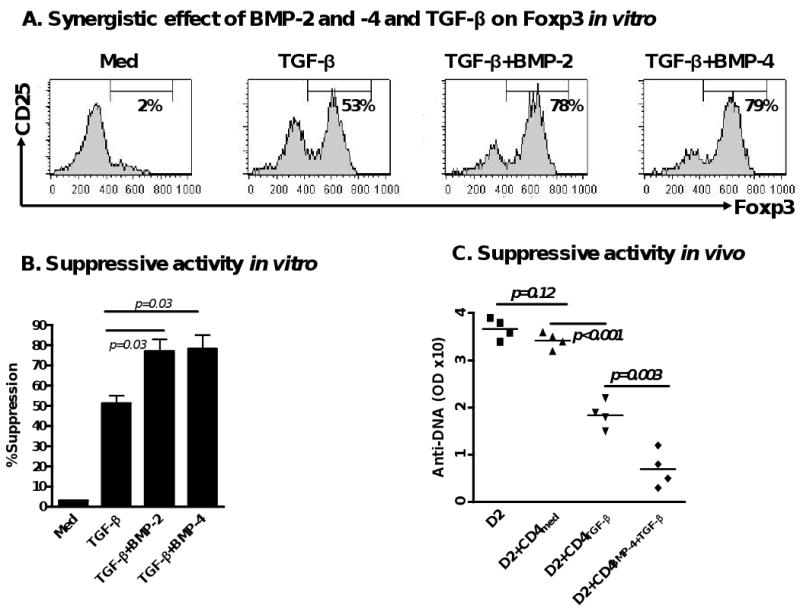
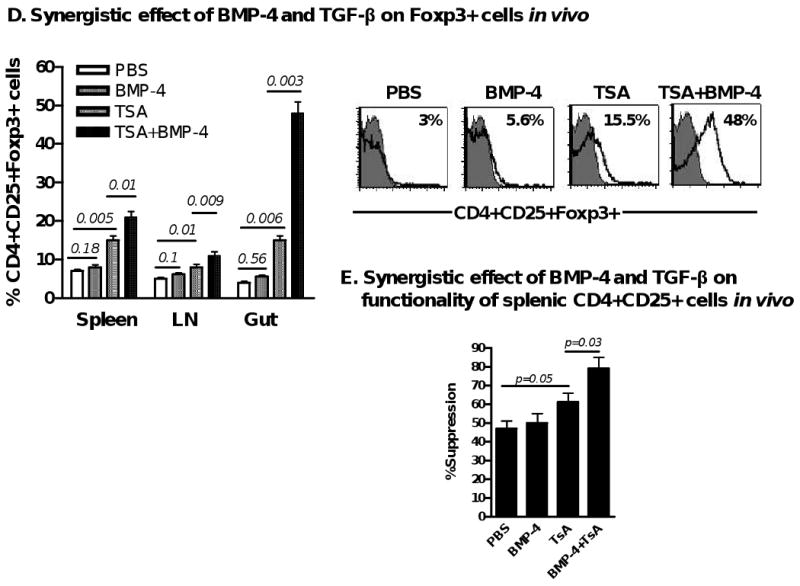
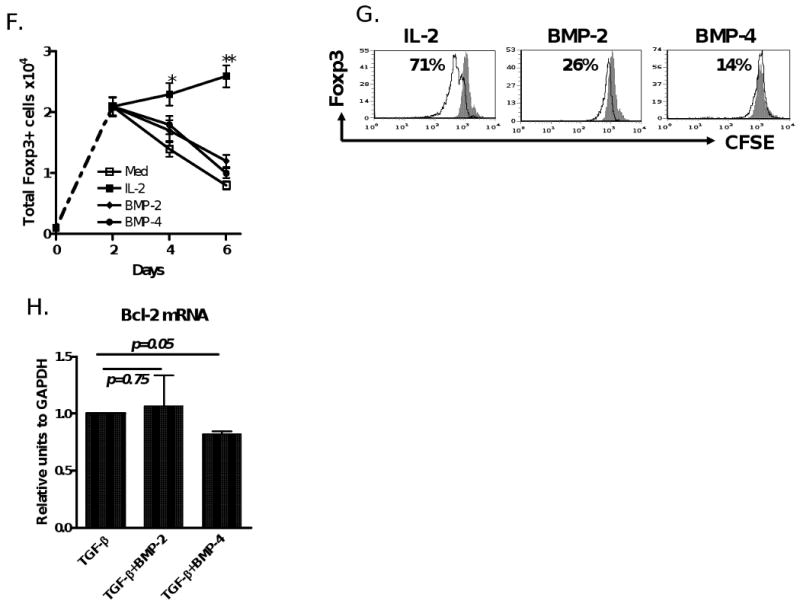
BMP-2/4 enhances TGF-β induced development of CD4+Foxp3+ Treg. (A) Effect of BMP-2/4 on the Foxp3 expression on CD4+ cells. Suppressive activities of Treg subsets against T cell proliferation in vitro (B) and anti-dsDNA production in cGVHD with a lupus syndrome model (n=4 mice each group) (C) were determined described the in the Materials and methods. Values are the mean ± SEM of three separate experiments (B). (D) The frequency of CD4+CD25+Foxp3+ cells in spleen, LN and gut of mice receiving PBS, or BMP-4, or TsA, or BMP-4+TsA at day 12 after treatment. Values indicate Mean ± SEM (left panel) of three mice in each group and representative of these experiments (right panel). Experiment was repeated with similar results. (E) Splenic CD4+CD25+ cells were sorted by FACSVantage and their suppressive activity against T cell proliferation in vitro was analyzed as panel A. (F and G). CD4+Foxp3+ cells were induced for 2 days as in Fig. 1 and labeled with CFSE, and stimulated with either IL-2 (40 units/ml), or BMP-2 (10 ng/ml), or BMP-4 (10 ng/ml) for additional 4 days. Total Foxp3+ cells were counted every two days (F) and Foxp3+ cell proliferation levels were analyzed by the dilution of CFSE dye on day 6 (G). Values indicate Mean ± SEM of three separate experiments (F) and the data presented are representative of these experiments (G). (H) Bcl-2 mRNA expression was determined by quantitative RT-PCR. Data show mean ± SEM of triplicate samples and experiment was performed with similar results.