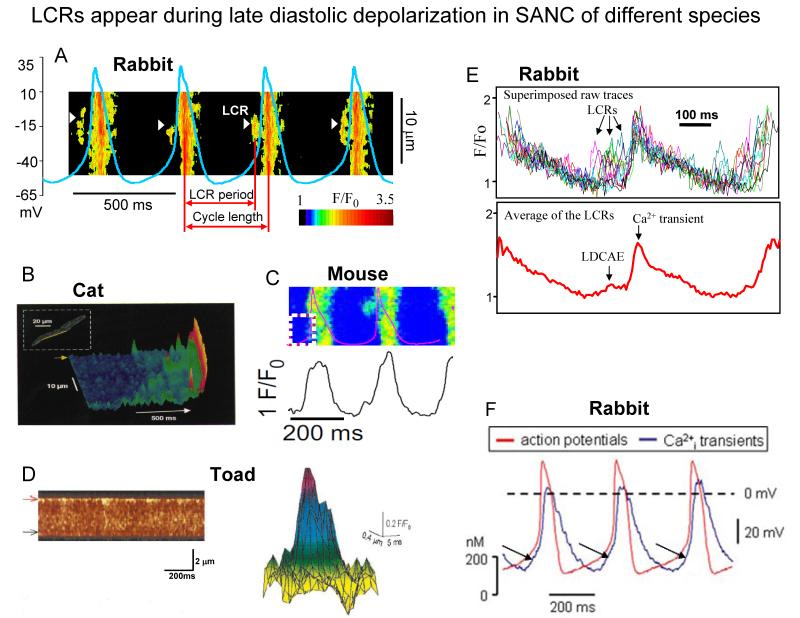
Fig. 3. LCR appear during late diastolic depolarization in SANC of different species.
A. Line-scan image of LCRs with superimposed spontaneous APs in rabbit SANC. White arrowheads show LCRs. The LCR period is defined as indicated. Modified from27. B. local Ca2+ releases in cat latent pacemaker cells (from8, with permission). C, A line-scan image of LCRs with superimposed spontaneous APs in a mouse SANC (from22, with permission). D. Ca2+ sparks in toad pacemaker cells: (left) a line-scan image showing regions of localised, transient increase in fluorescence along the upper border of the toad pacemaker cell; (right) intensity map of fluorescence of a composite spark obtained by superimposing 11 sparks (from7, with permission). E. Confocally measured subsarcolemmal LCRs (upper panel) in rabbit SANC. The temporal average of the individual LCRs within each cycle (lower panel) generates Late Diastolic Ca2+ Elevation (LDCAE) that precedes Ca2+ transient induced by action potential. Modified from104. F. Superimposed APs (red trace) and associated Ca2+ transients (blue trace) recorded in rabbit SANC (LDCAE are indicated by arrows) (from24, with permission).

