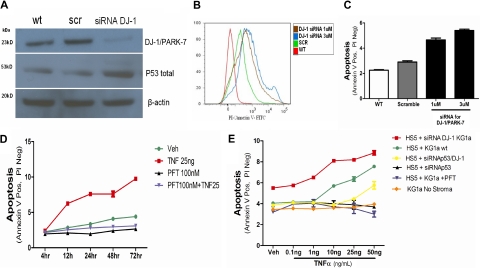
Figure 5.
p53 and apoptosis induction in KG1a cells. (A) DJ-1 and p53 protein levels in KG1a cells cultured without stroma. The expression of DJ-1 was analyzed by Western blot (wt). KG1a cells were transfected either with a scrambled siRNA (scr) or a DJ-1–specific sequence (siRNA DJ-1). There was an inverse correlation between decrease in protein expression of DJ-1 and levels of p53. (B-C) Inhibition of DJ-1 by siRNA and TNF-α–triggered apoptosis in KG1a cells cultured without stroma. Apoptosis (determined by flow cytometry) in control cultures containing unmodified KG1a cells (WT) and in cocultures with HS5 cells transfected either with a scrambled siRNA sequence (scramble) or siRNA specific for DJ-1 (at 1μM and 3μM). (B) Histogram shows intensity of annexin V staining in KG1a CD45+ cells. (C) Proportion of apoptotic cells; only CD45+ (KG1a) cells were considered. (D) Inhibition of p53 in coculture prevents TNF-α–induced apoptosis. KG1a cells were analyzed by flow cytometry. The y-axis shows proportion of APC-CD45+ KG1a cells positive for fluorescein isothiocyanate/annexin V and negative for propidium iodide (early apoptosis). Shown are untreated cells (veh), cells treated with TNF-α at 10 or 25 ng/mL, with PFT-α at 100nM (in dose-response experiments inhibition of apoptosis was seen at PFT-α concentrations > 1nM), or a combination of TNF-α (at 25 ng/mL) plus PFT-α (at 100nM), over a time course of 4 to 72 hours. (E) Dose-response to TNF-α under different conditions. TNF-α achieved measurable apoptosis at concentrations greater than 1 ng/mL in cocultures of HS5 cells with unmodified (wt) KG1a cells. Apoptosis was enhanced if DJ-1 on KG1a cells was repressed by siRNA. Apoptosis was prevented by PFT or siRNA inhibition of p53. Apoptosis was also prevented by simultaneous repression of DJ-1 and p53 by specific siRNAs; only at very high TNF concentrations was a low rate of apoptosis observed. Data are represented as mean percentage of early apoptotic cells ± SEM (annexin V positive but negative with propidium iodine). Results summarize data from at least 3 experiments, each conducted in triplicate.

