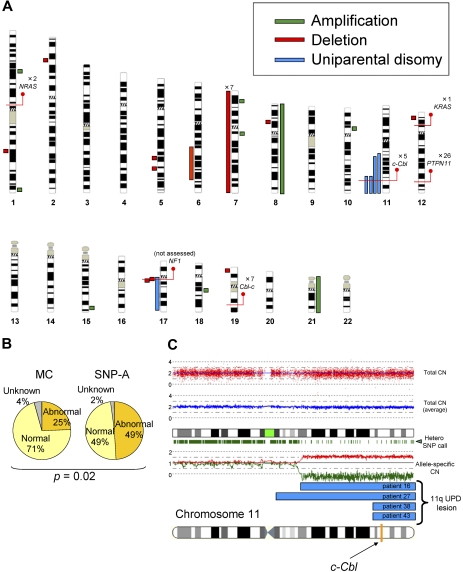
Figure 1.
Single nucleotide polymorphism array–based karyotyping of JMML. (A) Genomic distribution and type of lesion identified in patients with JMML by SNP-A analysis. Green bar represent amplification, red shows deletion, and blue corresponds to UPD. Red lines pinpoint the locus of genes discussed in the text, as well as the number of patients mutated at that locus. NF1 mutational status was not assessed in this cohort. (B) Increased sensitivity of SNP-A for detecting chromosomal lesions. The results of MC (25%) and by SNP-A (49%) from the JMML cohort studied are shown. (C) Representative 250-K SNP-A analysis of UPD11q by CNAG Version 3.0 (patient 16). Both the raw and averaged total copy number (CN) tracks (red dots, blue line) show a normal copy number, whereas heterozygous SNP calls and allele-specific copy number tracks (green dashes, red/green lines) show a reduction in copy number, indicating UPD. The specific localization of 11qUPD in 4 patients (patients 16, 27, 38, and 43) is indicated by the blue bars. The c-Cbl locus is indicated on the chromosome 11 idiogram with a yellow line.

