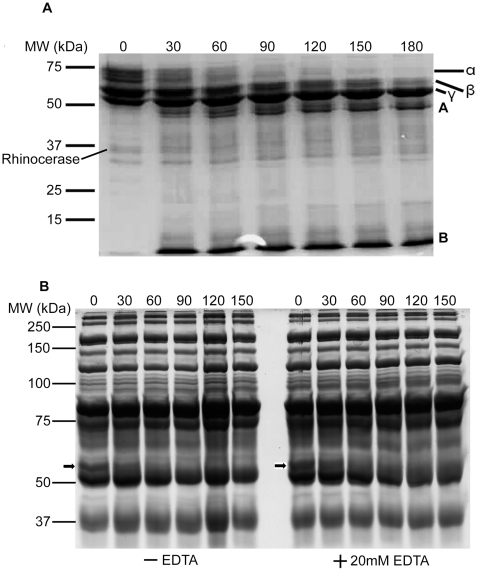
Figure 5. Fibrinogenolytic activity of rhinocerase.
Coomassie brilliant blue stained SDS-PAGE gels containing samples taken at different time intervals during the incubation of 100 µg of rhinocerase with 400 µl (5 mg/ml) of plasminogen-free fibrinogen in 0.05M Tris-HCl; 0.1M NaCl, pH 7.8 or 400 µl of human plasma in the presence and absence of 20 mM EDTA. The numbers at the top of each lane represent the time (in minutes) when samples were taken during the digestion. A. The degradation profile of plasminogen-free fibrinogen by rhinocerase. α, β and γ represent the three chains of fibrinogen and A and B represent the degradation products. The position of rhinocerase has been labelled on the image. B. The degradation profile of fibrinogen present in human plasma after removal of albumin and IgG by Proteoprep immunoaffinity albumin and IgG depletion columns. The position of the α chain of fibrinogen is marked with an arrow. Data are representative of three separate experiments.

