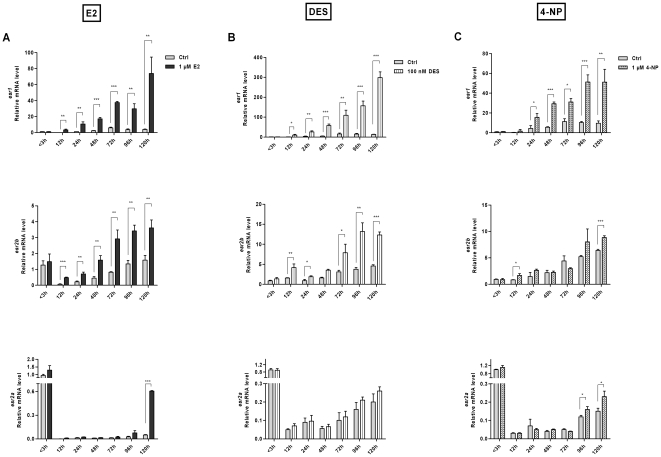
Figure 3. Effects of natural or synthetic ligands on esr expression levels in early-life stages.
Expression levels of esr genes in embryos and early larvae in absence (ctrl) and presence of ligand. Embryos were exposed to E2 (1 µM), DES (100 nM), 4-NP (1 µM) or solvent control (0.1% ethanol) one-hour post fertilization until processed for qPCR. Transcript levels after treatment with E2 (A), DES (B) or 4-NP (C) are shown. Data are represented as mean ± SD of three independent experiments. Statistical significance was measured by Students's t test and asterisks (* p<0.05; ** p<0.01; ***p<0.001) indicate significant differences between the control and ligand treated groups for each developmental stage.

