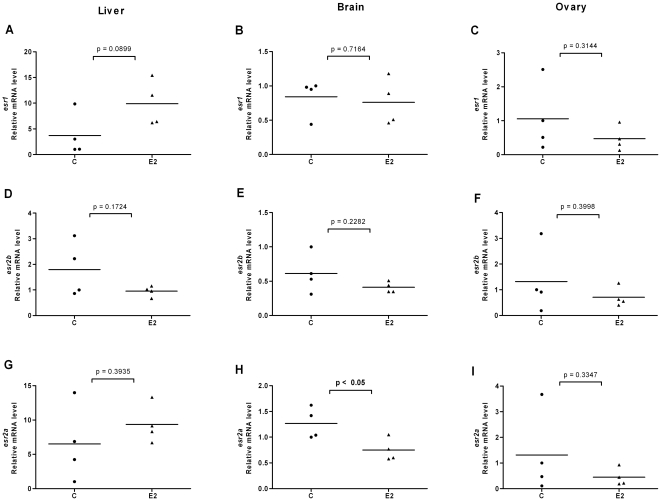
Figure 4. Effects of 17β-estradiol on esr expression in liver, brain and ovary of female fish.
Expression levels of esr1 (A–C), esr2b (D–F) and esr2a (G–I) in liver, brain and ovary of female zebrafish following exposure to E2 (1 µM). Ethanol (0.1%) was used as solvent control and adult females were exposed to E2 or solvent control for 48 h and mRNA levels of esr1, esr2b and esr2a were quantified. After normalization with beta-actin the expression levels of individual fish of both groups are shown. The mean value is indicated by a line.

