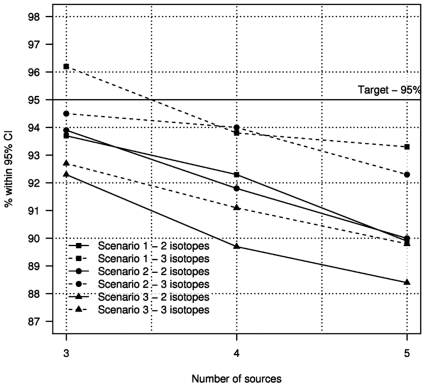
Figure 2. Proportion of 1000 simulated data sets where true values lie inside 95% intervals.
The model performs well for all of the different scenarios considered. The figure shows the deterioration of model predictions as the number of sources is increased. Performance can be improved by increasing the number of isotopes used.

