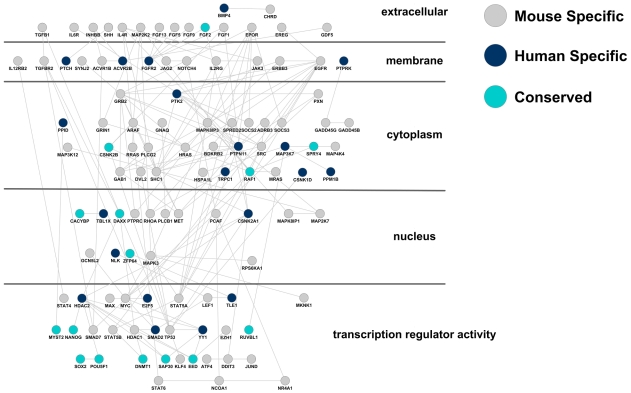
Figure 3. Induced components of signaling pathways in hES and mES cells.
The gene induced in either hES or mES cells, i.e., Clusters (2, *), (3, *) and (*, 3), are mapped onto all the signaling pathways documented in the KEGG database [33] and plotted using Cytoscape software (www.cytoscape.org). Gray, blue and green nodes represent genes that are induced in hES cells only, mES cells only or both (conserved), respectively. The edges between any two nodes represent known protein-protein interactions documented in Cytoscape.

