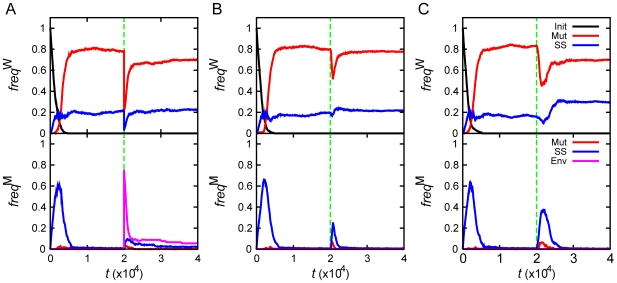
Figure 4. Causes of the rise and fall of mutator clones.
Frequencies of non-mutator (freq W) and mutator (freq M) clones that arise from various causes are shown as function of time (t). Colors indicate main molecular causes of the rise and fall of mutators: Red represents genotypic mutation (Mut), blue represents stochastic phenotype switching (SS), and magenta represents an environmental change (Env). The black line (Init) is the original non-mutator population. Panels A, B, and C respectively correspond to population dynamics in undergoing heat shock, stationary phase, and starvation stress at t = 20000.

