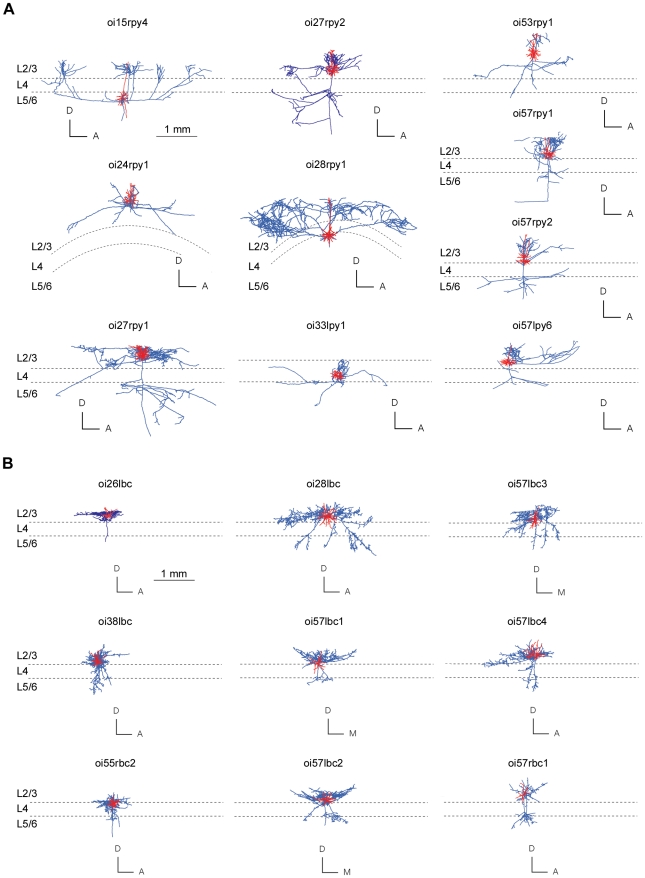
Figure 1. Morphology of spiny and basket cells analysed in study.
(A) Spiny cell axons (blue lines) and dendritic (red lines) arbors of each neuron shown in coronal plane against approximate laminar boundaries (n = 10). (B) Basket cell axons (blue lines) and dendritic (red lines) arbors of each neuron shown in coronal plane aligned with approximate laminar boundaries (n = 9). Cell identifiers matched with results given in Table S1. For clarity, axonal boutons are not shown. (Anatomical axes: A, anterior; D, dorsal; M, medial).

