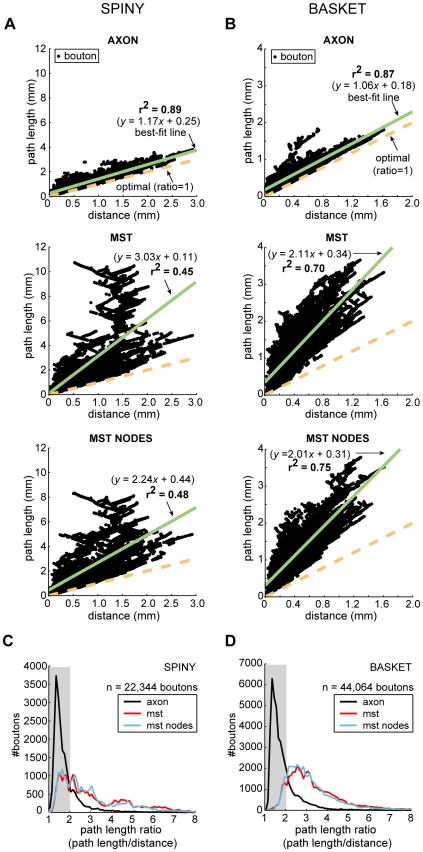
Figure 13. Neocortical axons, unlike wire-minimized arbors, preserve cortical distance-path length relationship.
(A) Spiny cell axons (top) regression line (solid green line) diverged little from optimal slope (path length/distance ratio = 1, dotted gold line) and was much better correlated compared with MSTs either without (middle) or with axon bifurcations (nodes) as additional vertices (bottom). Black dots represent single bouton measurements, n = 22,344 boutons. (B) Basket cell axons (top) regression line likewise diverged little from optimal slope and was marginally better correlated compared with MSTs either without (middle) or with the addition of axon bifurcations (bottom), n = 44,064 boutons. (C) Spiny cell axon path length ratio distribution (black line) showed a sharp initial peak followed by a slower exponential-like decay with 82% of ratio <2 (grey shaded region), compared with the broader distributions of MSTs without (red line) and with the addition of axon bifurcations (blue line) with 33–34% only of ratio <2. (D) Basket cell axon path length ratio distribution had a similar shape to spiny cells', 78% of paths with ratio <2, while the wider distributions of MSTs without and with axon bifurcations as additional vertices, with around 12–13% of ratio <2, peaked near ratio of 3. The strong similarity between spiny and basket axon path length ratio distributions implies a common (temporal) cost constraint mechanism.

