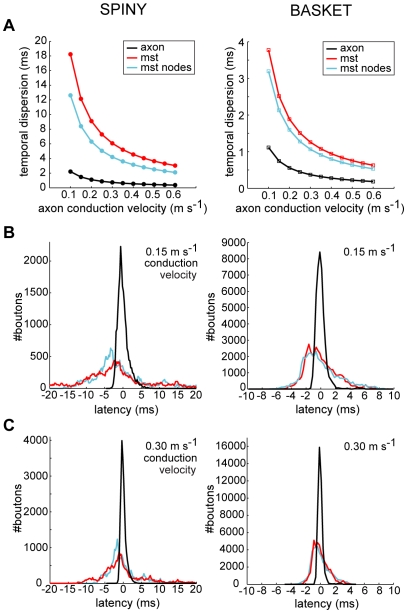
Figure 14. Temporal dispersion of neocortical axonal latencies was much less than wire-minimized arbors.
(A) Degree of temporal dispersion (standard deviation) of spiny cell axons latencies (left, black line), independent of conduction velocity, was six to eight times and basket cell latencies (right, black line) around three times less than corresponding MST with (blue line) or without additional axon bifurcation points (red line), suggesting wire minimization increased temporal dispersion. Addition of axon bifurcations in MSTs reduced the degree of temporal dispersion. Standard deviation was measured by deviation from the respective regression lines shown for path length in Figure 13AB. Comparison of predicted latency distributions of axon arbors and MSTs at (B) 0.15 m s−1, and (C) 0.30 m s−1 conduction velocities illustrates the sharpness of axonal temporal dispersion compared with broader wire minimization results (N.B. total number of paths constant across conditions).

