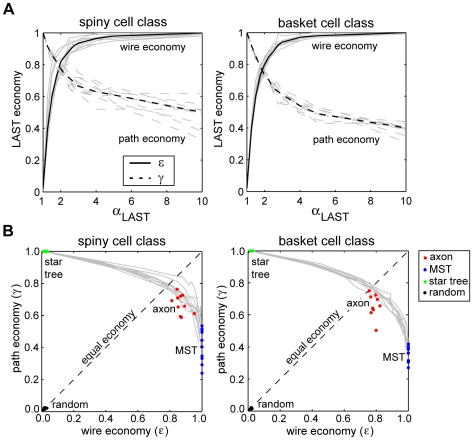
Figure 16. Neocortical axon arbor design represents a trade-off between spatial and temporal communication costs.
(A) Light-approximate spanning tree (LAST) algorithm shows for each arbor that as the maximum path length ratio determined by αLAST increased so wire and path economy proved opposing objective functions for both spiny (left) and basket cell class axon arbors (right). At around αLAST = 1.9 the separate economy curves achieve equilibrium with parameters matched at ≈0.79. Light grey curves represent individual arbor results while thick black lines represent mean economy results (solid lines = wire economy, dashed lines = path economy). (B) Relative to trade-off curves in the economy plane generated by LAST algorithm (solid grey lines) the results show spiny (left) and basket cell axons (right) were suboptimal for wire length economy (ε) compared with wire-minimized MST and were suboptimal for path length economy (γ) compared with path-minimized star trees. Most neocortical arbors lay on or near the trade-off curves with a slight bias towards wire minimization relative to equal economy line (dotted black line). In comparison, randomized trees were close to the origin of the economy plane indicating the degree of axon economy.

