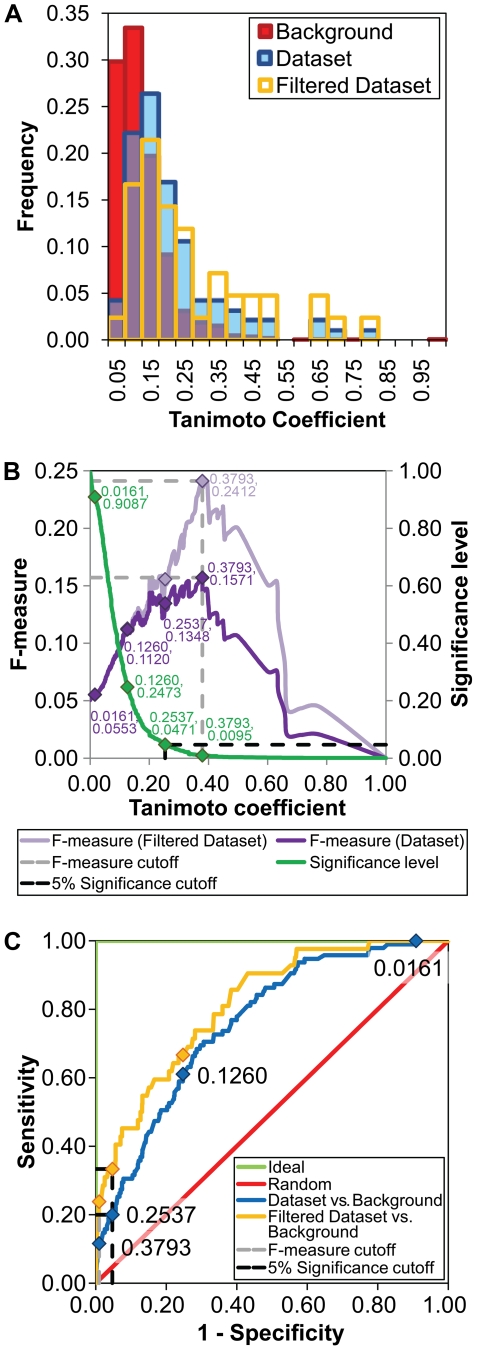
Figure 3. Mechanistic similarity.
(A) Distribution of mechanistic similarity scores for pairs of reactions in the background dataset (Background), for all functionally analogous pairs in the dataset (Dataset), and for functionally analogous pairs with high overall reaction similarity (Filtered Dataset). (B) F-measures for the dataset and filtered dataset, and significance levels at all possible mechanistic similarity scores. Selected scores are shown within the plot, including the cutoff for similarity where the F-measure is maximized (0.3793), and the cutoff at the 5% significance level (0.2537). (C) ROC curves for the mechanistic similarity scores of pairs of reactions in the dataset assessed against those in the background (Dataset vs. Background, AUC = 0.76), for pairs in the filtered dataset assessed against those in the background (Filtered Dataset vs. Background, AUC = 0.81), for an ideal classification method with no false positives and false negatives (Ideal, AUC = 1.00), and for a non-discriminating classification method (Random, AUC = 0.50). Selected mechanistic similarity scores are shown within the curves.

