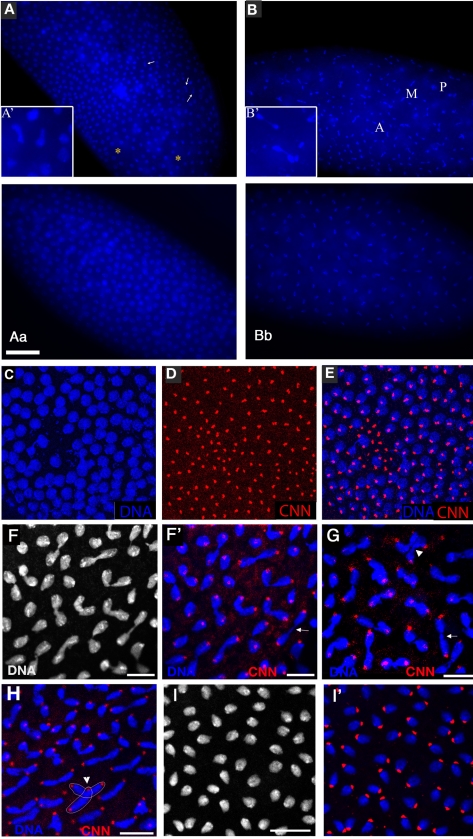
Figure 3. xpdeE embryos show nuclear division defects, loss of division synchrony, and chromosomal instability.
(A) Arrows point to undivided nuclei in a cycle 12 xpdeE embryo. “*” marks regions without nuclei. Staining was with Hoechst and polyploid yolk nuclei in the center of the embryo are also visible in this epifluorescence micrograph. (Aa) Wild-type interphase 12 control. Bar is 50 µm. (B) This cycle 11 xpdeE embryo shows unsynchronized nuclear divisions. P: prophase; M: metaphase; A: Anaphase. Nuclear fusion (A′) and chromatin bridges (B′) are frequently seen in the mutant embryos. (Bb) Wild-type metaphase 11 control showing the tight cell cycle synchronization of the nuclei on the surface. (C–E) Part of an xpdeE embryo stained with Hoechst (blue, DNA) and anti-CNN antibody (red) to visualize centrosomes. The region lacking nuclei shows free centrosomes. (F–H) Incompletely segregated chromosomes are partially or fully decondensed (note the differences in condensation between the centromeric heterochromatin and the euchromatin that is decondensed). DNA is stained with Hoechst (white and blue). Note the banana shaped mitotic figures. (F′–H) Additional CNN staining marking the centrosomes is shown in the red channel. Arrows point to chromosomal material left back at the central spindle. Arrowheads point to dividing chromosomes from neighboring mitotic figures that are closely associated (G) and to a situation where two neighboring mitotic figures cross one another (also outlined in H). (I) Wild-type (xpd−/+) control embryos of the same stage stained with Hoechst. (I′) Same control embryos as in (I) also stained for CNN in red. Scale bars represent 10 µm.

