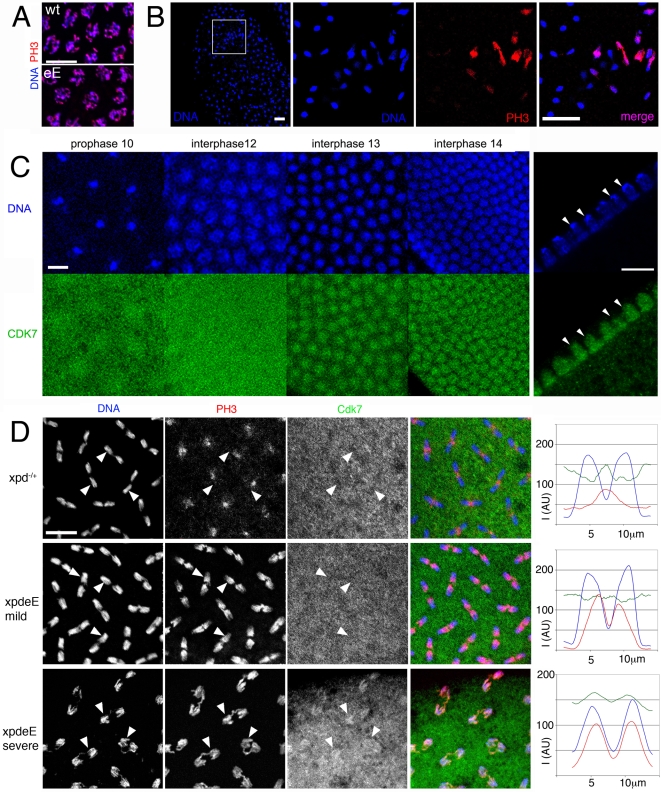
Figure 6. Disruption of dynamic subcellular localization of Cdk7 and of Cdk1 activity in xpdeE embryos.
(A) PH3 staining of wild type (wt: xpd−/+) and xpdeE (eE) embryos does not reveal differences in Cdk1 activity during a normally initiated prophase. Scale bar represents 10 µm. (B) Local mitotic defects and loss of cell cycle synchronization in xpdeE embryos. Some areas lack chromosomal DNA (left panel, outlined area is shown magnified in the adjacent panels), while others show interphase chromosomes (blue, lacking red PH3 staining) side by side with patches of mitotic chromosomes that stain for PH3 (red). The embryo also shows ana- and telophase figures where PH3 staining persists too long. Wild type telophase figures do not stain for PH3 anymore (not shown). Scale bar represents 20 µm. (C) Cdk7 staining of syncytial wild type embryos changes during the later cycles. Cross-section through interphase 14 nuclei (right panels) reveals that Cdk7 is depleted from heterochromatic regions that strongly stain for the DNA dye Hoechst (arrowheads; scale bar 10 µm). (D) Polar loss of PH3 staining (red) from cycle 12 anaphase chromosomes (blue) is seen in embryos with Xpd (heterozygous xpd−/+were used here), where Cdk7 (green) gets slightly excluded from the chromosomal region (upper panels). Arrowheads allow following individual chromosomal regions in the different channels. In the mild defects seen in xpdeE embryos PH3 staining is seen on the central half of the anaphase chromosomes and Cdk7 signal is uniformly distributed (middle panels). In the more severe cases (bottom panels) the entire chromosomes are still PH3 positive and this correlates with a chromosomal enrichment of Cdk7 (bottom panels). Signal intensity for the three different channels was measured along the axis of five anaphase figures. The results are plotted in the right panels. I is intensity and AU are arbitrary units. Scale bar represents 10 µm.

