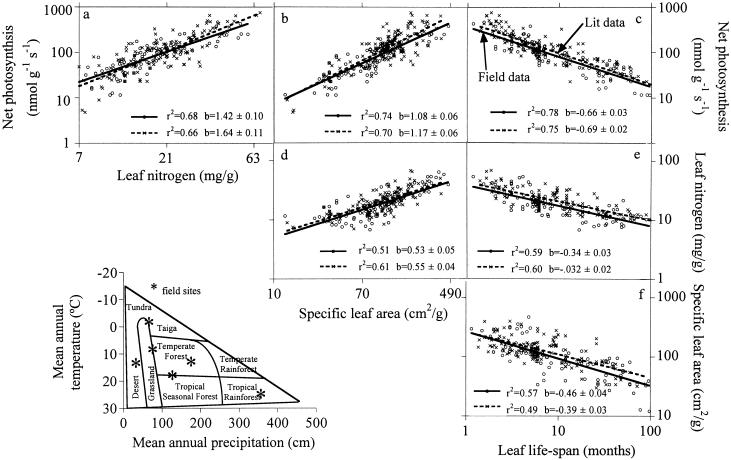
Figure 1.
(a–f) Relations (of the form Y = aXb) among mass-based photosynthetic capacity, SLA, and leaf nitrogen concentration of young mature leaves and their expected life-span, fitted by type I regression (of log y = a + b∗log X) for species in two data sets (—o—, our field data for 111 species from six biomes; —x—, the global literature data set). The coefficients of determination (r2) and the power function (scaling) exponents (b ± 1 SE) are shown in each panel (all P < 0.001). (Inset) Diagram of global biome distribution in relation to annual temperature and precipitation (12) and location of our six field sites on that matrix.

