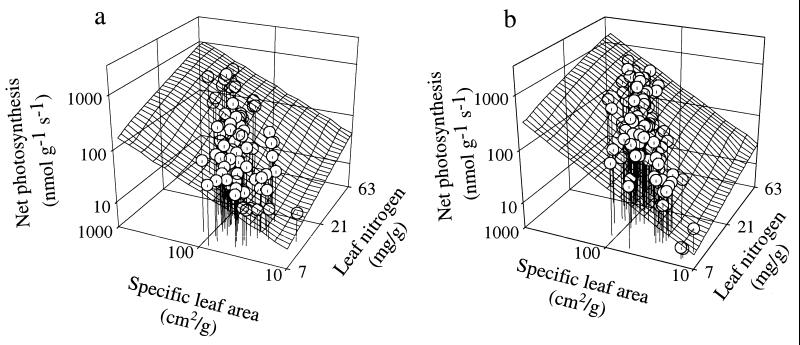
Figure 2.
(a and b) Relations (all variables were log10-based) between Amax vs. leaf N and SLA using multiple regression of Amax as a function of leaf N (P < 0.001) and SLA (P < 0.001). (a) Field data from six biomes: log10 (Amax) = −0.46 + 0.77∗log10 (N) + 0.71∗log10 (SLA); r2 = 0.85, n = 104, P < 0.001. (b) Literature data: log10 (Amax) = −0.76 + 0.88∗log10 (N) + 0.82∗log10 (SLA); r2 = 0.8, n = 109, P < 0.001.

