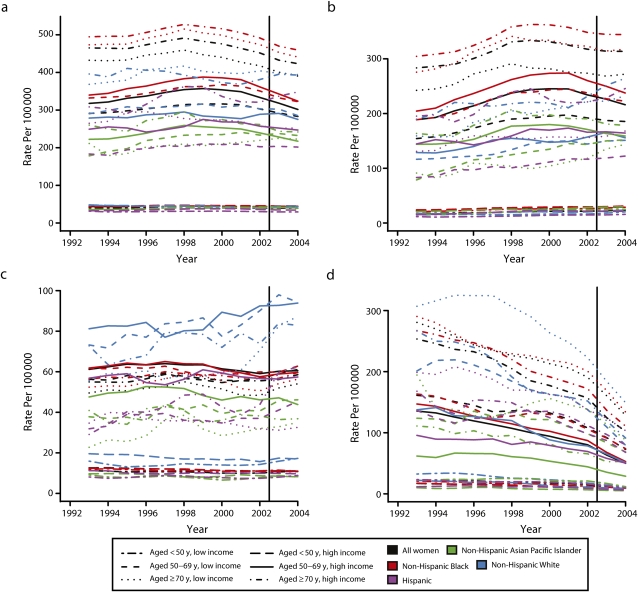
FIGURE 1.
Age-standardized breast cancer incidence rates (per 100 000; for all women and by race/ethnicity), stratified by county income level and age, for (a) all cases, (b) estrogen receptor (ER)-positive cases, (c) ER-negative cases, and (d) ER status unknown cases: US Surveillance, Epidemiology and End Result (SEER) 13 Registries Database, 1992–2005.
Note. Rates are based on 3-year rolling averages, standardized to the year 2000 standard million.

