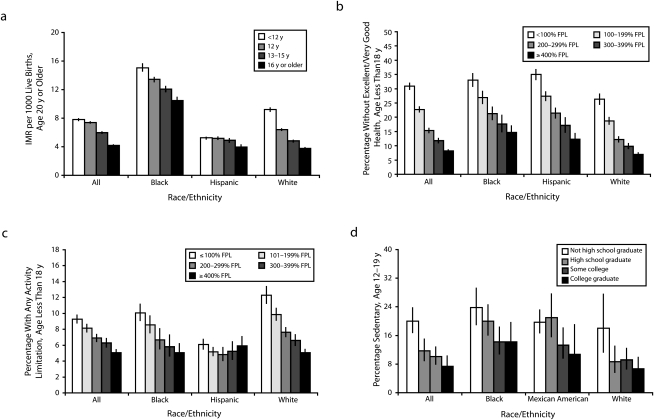
FIGURE 1.
Income and education disparities in child health by (a) infant mortality, (b) health status, (c) activity limitation, and (d) sedentary behavior: United States, 1999–2005.
Note. FPL = federal poverty level; IMR = infant mortality rate; Black = non-Hispanic Black; White = non-Hispanic White. All racial/ethnic groups are mutually exclusive. Source. Data for panel a is from the Period Linked Birth/Infant Death Data File, 2000-2002.46 Data for panels b and c are from the National Health Interview Survey, 2001-2005.48 Data for panel d is from the National Health and Nutrition Examination Survey, 1999-2004.49

