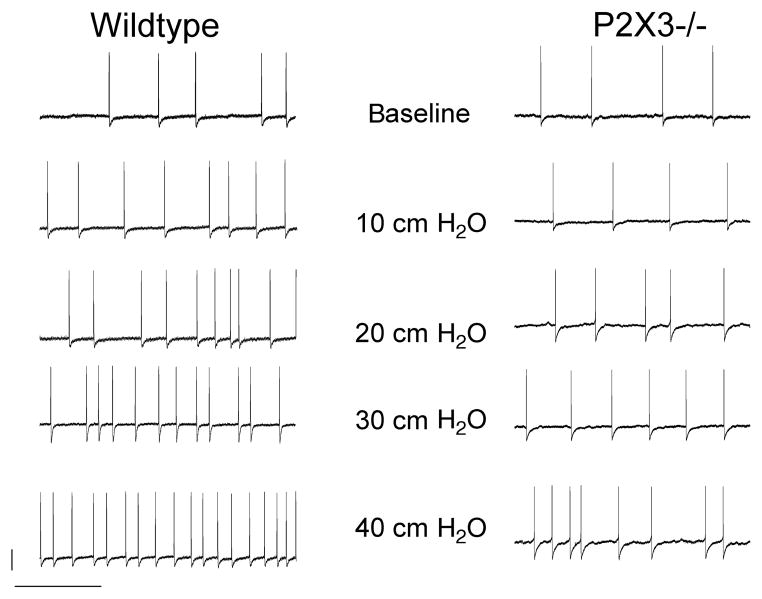
Figure 2.
Representative voltage tracings demonstrate the effects of gastro-oesophageal distension on action potential firing. The upper tracings demonstrate little baseline activity for wildtype (left) and P2X3−/− mice (right). Stepwise distension led to an increase in action potential frequency as shown in the lower tracings. Data were obtained 10 s after initiation of the stimulus. The calibration bars represent 20 mV and 1 s respectively.

