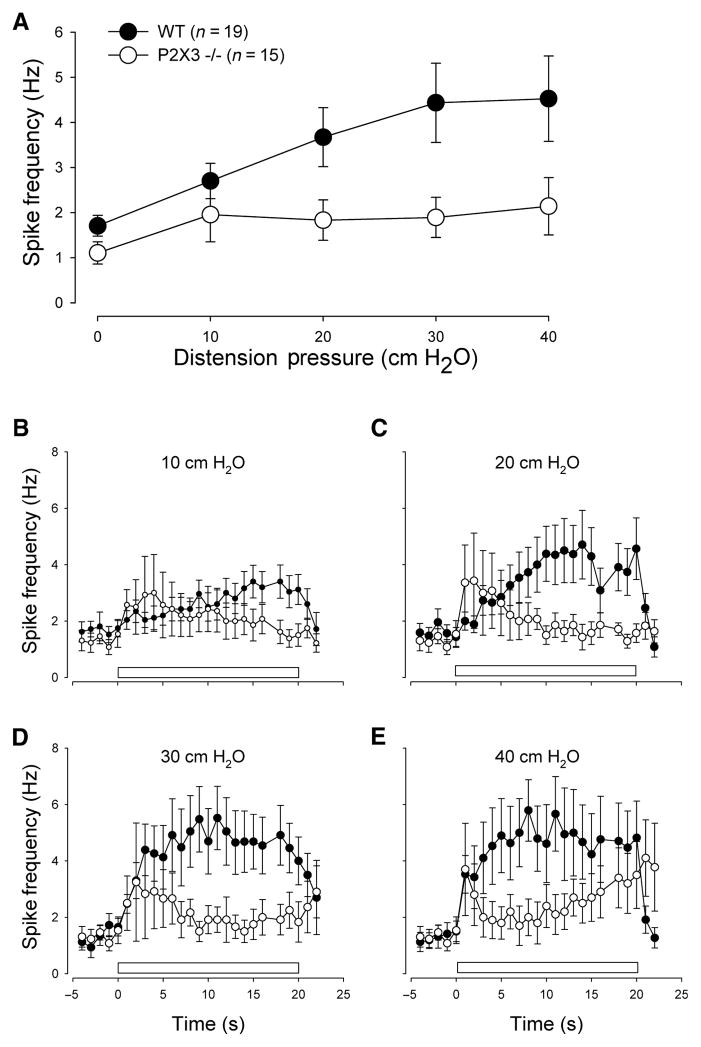
Figure 3.
Response to gastric distension. The upper panel (A) shows the average spike frequency in gastric nodose neurons during stepwise fluid distension, measured during a 20-s interval in wildtype (filled circles) and P2X3−/− mice (open circles). Differences between the groups were significant (F = 6.2; P < 0.02). The lower panels show a more detailed time course for the distension pressures of (B) 10 cmH2O (F = 10.2; P < 0.01), (C) 20 cmH2O (F = 35.5; P < 0.01), (D) 30 cmH2O (F = 49.8; P < 0.001) and (E) 40 cmH2O (F = 31.8; P < 0.001). The bar represents the time of luminal pressure application.

