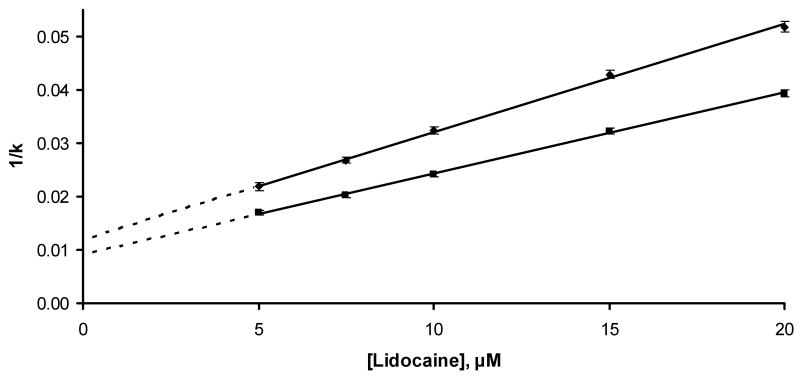
Figure 5.
Plot made according to Eqn. (2) for injections of racemic propranolol on an AGP column in the presence of lidocaine in the mobile phase. The equation for the best fit line for R-propranolol was y = 0.00202 (± 0.00004) x + 0.0120 (± 0.0005) (r = 0.9993); the equation for the best fit line for S-propranolol was y = 0.00152 (± 0.00003) x + 0.0091 (± 0.0004) (r = 0.9995).

