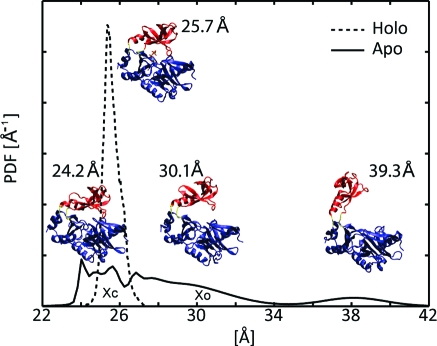
Figure 2.
Conformational distributions in the apo and holo states: Probability distribution functions (PDFs) of the distance separating the centers of mass of the OB and nucleotidyltransferase domains in the MD simulations. Xc and Xo indicate the locations of the closed and open crystal structures, respectively. The holo distribution is represented by a dashed line and the apo distribution by a solid line. Structures of selected conformations are labeled with the distance separating the centers of mass of their OB and nucleotidyltransferase domains. The three lower structures are representatives of the apo simulation while the single upper structure is a representative of the holo simulations. Coloring is the same as in Figure 1.

