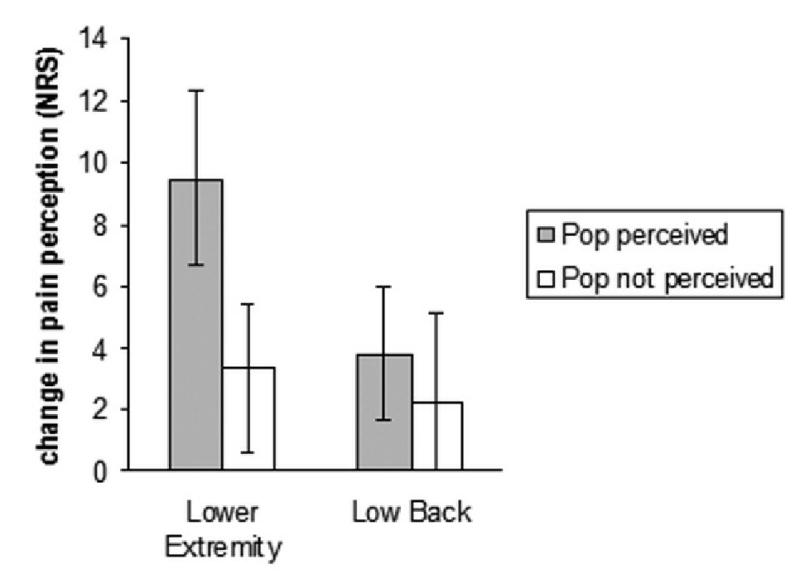
Figure 3. Change in temporal summation.

Key: Pre to post high velocity, low amplitude thrust manipulation change in self report of pain to standard thermal stimuli. Positive numbers on the Y axis indicate hypoalgesia. NRS= numeric rating scale anchored with 0= no pain at all and 100= worst pain imaginable. Error bars indicate one standard error of the mean.
