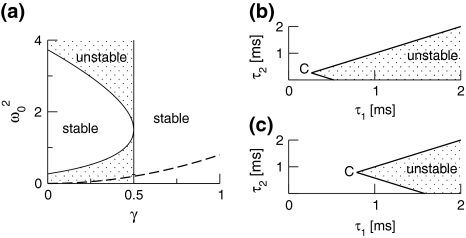
Fig. 7.
Stability regimes of the resting state at p = 1, i.e. prior to the administration of propofol. a The stable regime is given by Eq. 30 for γ < 1/2, while γ ≥ 1/2 leads to stability for all ω20. The specific result β2 ≈ 8.5β1 yields the specific solutions (31) represented by the dashed line: for γ < 1/2 the solutions are unstable and for γ ≥ 1/2 they are stable. b, c show the stability regime with respect to the excitatory time scales τ1, τ2 for the specific case β2 = 8.5β1 according to Eq. 32. The border point C is located at τ1 = τ2 = η1/38. b η1 = 10ms, c η1 = 30ms.

