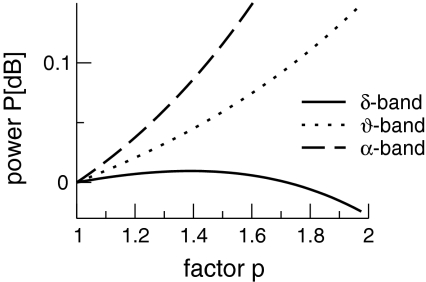
Fig. 9.
The spectral power in different frequency bands in the single solution case. p is the power enhancement and defined as p = 10log10 (PEEG(ν)/PEEG(0)). The frequency bands are defined in the intervals [0.1 Hz;4 Hz] (δ-band), [4 Hz;8 Hz] (θ-band) and [8 Hz;12 Hz] (α-band). Here ce = ci = 0.06/mV and other parameters are taken from Fig. 8 and section "Methods"

