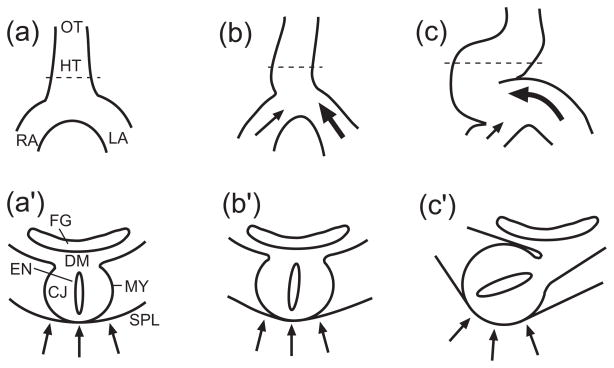
Figure 1.
Schematic for cardiac rotation hypothesis. Ventral views (a,b,c) and cross-sectional views (a′,b′,c′) are shown, with locations of cross sections indicated by dashed lines in a,b,c. (HT = heart tube, LA = primitive left atrium, RA = primitive right atrium, OT = outflow tract, CJ = cardiac jelly, MY = myocardium, EN = endocardium, SPL = splanchnopleure, DM = dorsal mesocardium, FG = foregut) (a,a′) Straight heart tube before looping. (b,b′) Both atria push against caudal end of the heart tube, and relatively greater force exerted by the left atrium displaces and rotates the heart tube slightly toward the right. (c,c′) The splanchnopleure pushes the heart tube dorsally, completing torsion. (from 24)

