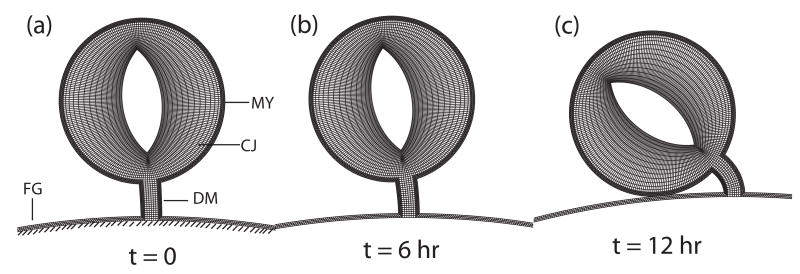
Figure 5.
Two-dimensional model for cardiac rotation including mechanical feedback in the myocardium. The time points shown in each case correspond to the experimental time points shown in Fig. 2D–F. (a) Model geometry for stage-10 heart (MY = myocardium, DM = dorsal mesocardium, CJ = cardiac jelly, FG = foregut wall). The heart is given a small initial rightward push, and then the load is removed. (b) Little rotation occurs during the first six hours. (c) After 12 hours, the heart has rotated fully. (from 24)

