Figure 6.
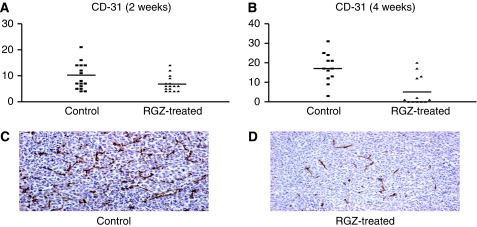
Immunohistochemistry (IHC) for CD-31 evaluation in tumour tissues from control (i.e., solvent treated) and rosiglitazone (RGZ)-treated (A, 2 weeks; B, 4 weeks) mice. Y axis: number of CD-31-positive cells per field. (C) Example of a field showing high CD-31 staining in the tissue sample from a control mouse. (D) Example of a field showing a few CD-31-positive cells after 4 weeks of treatment with RGZ ( × 100 magnification).

