Figure 3.
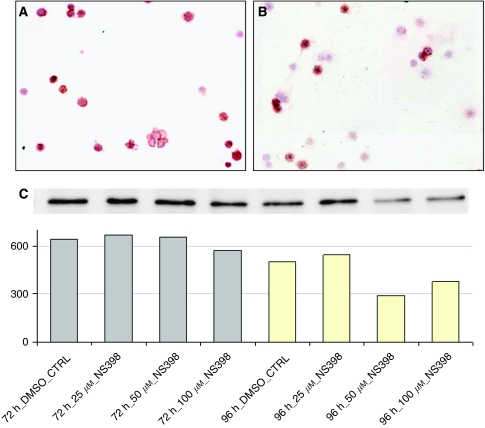
The decrease in COX2 protein expression under NS398 treatment. Dose-dependent inhibition of COX2 protein expression was observed under NS398 treatment. Strong granular and/or diffuse cytoplasmatic immunostaining was detected in COX2-positive cells. (A) COX2 protein expression in untreated control HT29 cells. (B) COX2 protein expression in HT29 cells treated with 100 μM NS398 ( × 10 magnification, haematoxylin co-staining). (C) COX2 protein expression detected by western blot analysis. The diagram shows the band intensities determined by Molecular Imaging Software version 4.0.

