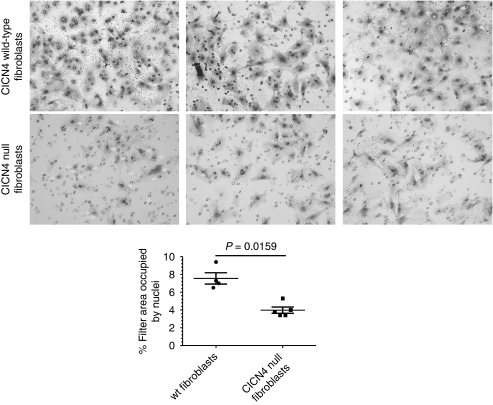
Figure 6.
Reduced invasiveness of null CLCN4 fibroblasts. These assays were as described for Figure 5, but with the following exceptions. The indicated cells (20 000) were seeded in triplicate on Matrigel-coated porous filters (8 μm) and, after 22 h, were assayed and quantified for invasion. Data are shown as the average percentage area of the filter occupied with nuclei±s.d. values of at least four independent fields. Nuclei are marked with white arrows. Statistical analysis was performed using a Mann–Whitney U-Test.

