
Figure 2. Development of anti-HLA antibodies after transplant.
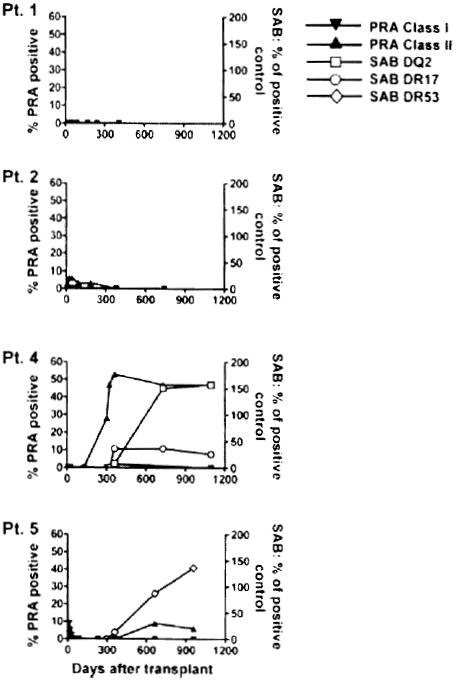
Serial serum samples from the four patients were tested for IgG reactive to a standard commercialized panel of cell lines expressing different HLA Class I and Class II antigens. Results are expressed as percentage of cell lines recognized by serum antibodies (left axis, panel reactive antibodies, PRA). The presence of donor-specific antibodies was assessed by a single HLA antigen bead Luminex assay using anti-HLA-DQ2 and -DR17 beads for Patient 4 and anti-HLA-DR53 beads for Patient 5. Signals are expressed as percentage of positive control (right axis).