
Figure 5. Protein array profiling of Patient 4 antibody response.
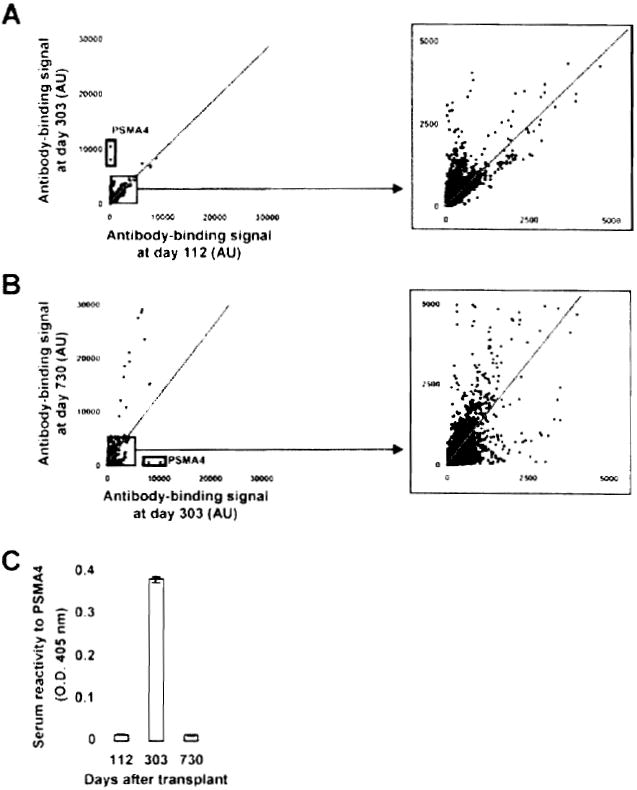
(A) Two dimensional scatterplot of IgG binding values obtained for all 8000 proteins on the array using serum samples collected at Day 112 (before detection of DSA and C4d; x-axis) and at Day 303 (time of detection of DSA and C4d; y-axis). All proteins are spotted in duplicate. Signals are expressed as arbitrary units (AU). Framed dots correspond to PSMA4, for which signal was most increased between the two time points. The depicted line was established using values obtained for array internal control proteins. Signal values falling within the range of this trend line correspond to proteins for which antibody titers did not change between the two samples. (B) Two-dimensional scatterplot comparison of IgG binding values obtained samples collected at Day 303 (time of detection of DSA and C4d; x-axis) and Day 730 (persistence of DSA and C4d; y-axis). Framed dots correspond to PSMA4, for which signal was the most decreased between the two time points. (C) Protein array data confirmation for PSMA4. The reactivity of Patient 4 serum samples collected at Day 112, Day 303 and Day 730 to recombinant PSMA4 was assessed by ELISA using an anti-IgG secondary antibody.