
Figure 6. Protein array profiling of Patient 5 antibody response.
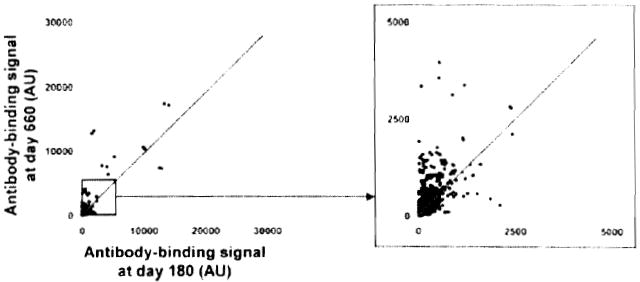
Two-dimensional scatterplot of IgG binding values obtained for all 8000 proteins on the array using serum samples collected at Day 180 (before detection of anti-DNA antibodies; x-axis) and at Day 660 (time of detection of DSA; y-axis). All proteins are spotted in duplicate. Signals are expressed as arbitrary units (AU). The depicted line was established using values obtained for array internal control proteins. Signal values falling within the range of this trend line correspond to proteins for which antibody titers did not change between the two samples.