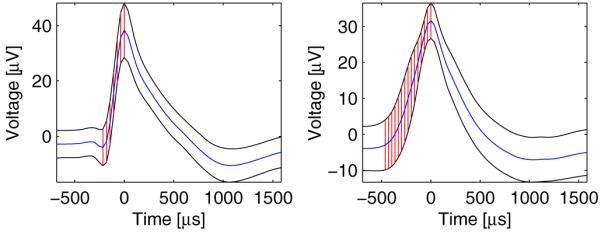
Figure 2.

Detection of the main rise and the area circumscribed by the average waveform ±1 standard deviation in two recorded units. (Left) A single cell in the left dACC of case 3 with a small ‘valley’ at the beginning of the main rise. Despite the ‘valley’, the maximal curvature estimate is accurate and lies exactly at the beginning of the main rise. (Right) A multiunit in the left SMA proper of case 9. As expected from a multiunit, the marked area is larger than that on the left or figure 1(E).
