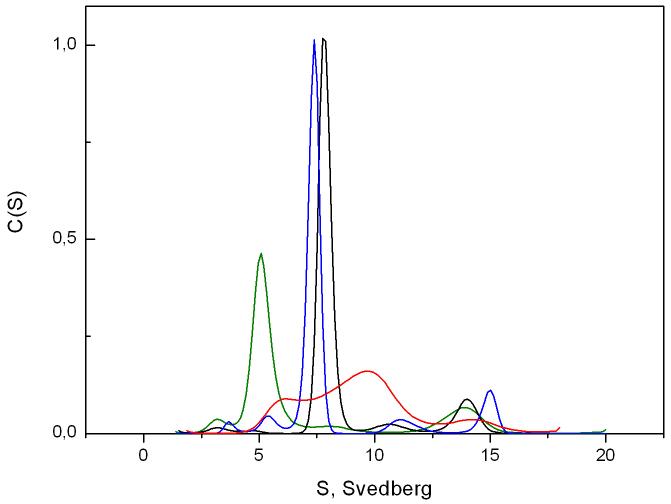
Fig. 1.
Distribution of the sedimentation coefficient c(s) of 13 μM tubulin (green line), 13 μM tubulin with 13 μM stathmin (black line), 13 μM tubulin with 6 μM vinblastine (red line) and 13 μM tubulin with 13 μM stathmin in the presence of 6 μM vinblastine (blue line) at 10°C. All RMSD values were under 0.02.

