
Figure 5.
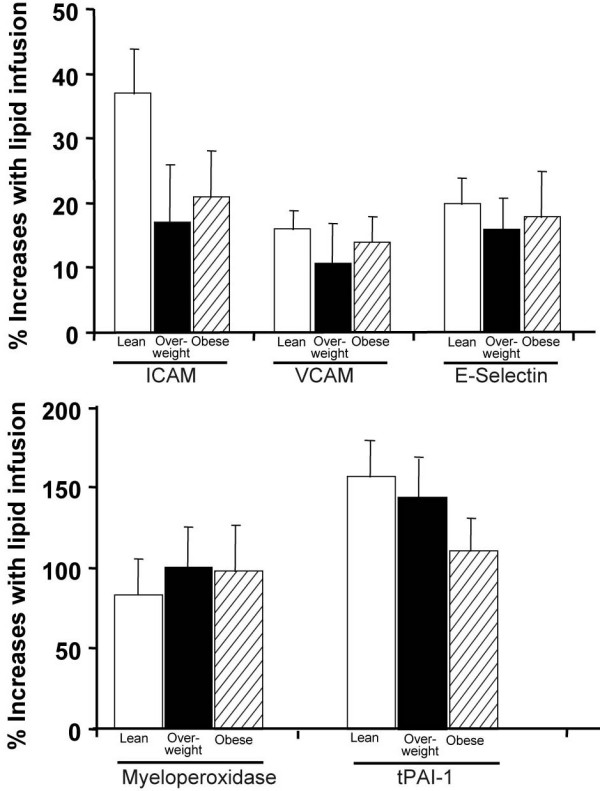
Figure5describes the response in subjects divided by BMI as either lean (BMI <25 kg/m2), overweight (BMI >25 and <30 kg/m2) or obese (BMI >30 kg/m2)
Official websites use .gov
A
.gov website belongs to an official
government organization in the United States.
Secure .gov websites use HTTPS
A lock (
) or https:// means you've safely
connected to the .gov website. Share sensitive
information only on official, secure websites.
Figure5describes the response in subjects divided by BMI as either lean (BMI <25 kg/m2), overweight (BMI >25 and <30 kg/m2) or obese (BMI >30 kg/m2)