
Figure 1.
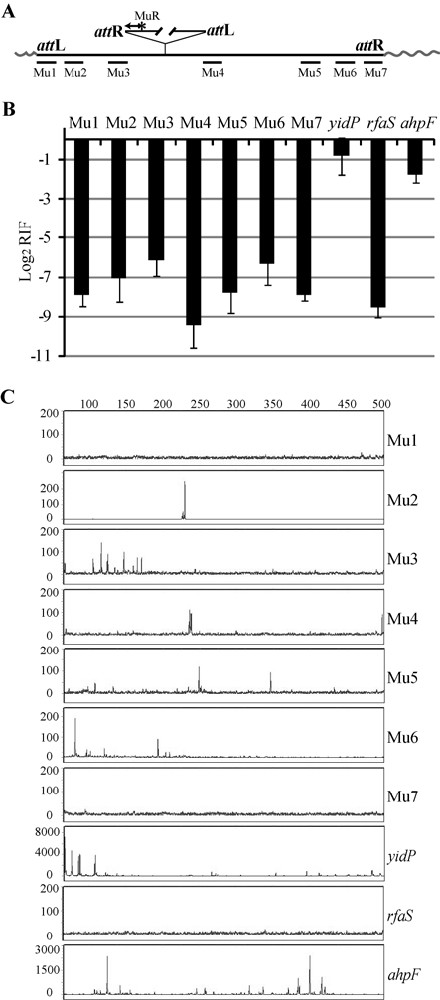
Quantification and profile of Mu insertions within Mu in vivo. (a) Experimental strategy. A common MuR primer (labeled* with 6FAM for experiments in (c)), anneals within the right end or attR of Mu. Primers annealing to seven different locations within Mu (Mu1 to Mu7) were each paired with MuR in PCR reactions to measure (b) the frequency and (c) the site of Mu insertions packaged in phage particles. Wavy lines indicate host DNA linked to Mu ends in packaged phage heads. (b) Real-time PCR reactions were performed using Mu DNA purified from phage prepared after induction of strain SJG3. Ct values are inversely proportional to the amount of nucleic acid of interest in the sample. Log2 of the relative insertion frequency (RIF) values were derived from Ct differences between samples and input Mu DNA control; primer pairs annealing within region 4 served as controls for input DNA. Primers hybridizing to E. coli genes known to be hot (yidP), cold (rfaS) and average (ahpF) Mu insertion targets were also paired with MuR as controls. Primer efficiencies were calculated as described in Methods. The data are an average of three technical repeats. (c) Profile of Mu insertions within the targets monitored in (b). PCR reactions were as in (b), except that MuR was labeled with the fluorescent primer 6FAM. The reactions were subjected to FLA. Numbers on the X axis refer to nucleotides. The intensity of the fluorescent signal reflects the frequency of insertion at a particular site and is represented by arbitrary numbers on the Y axis.