
Figure 6.
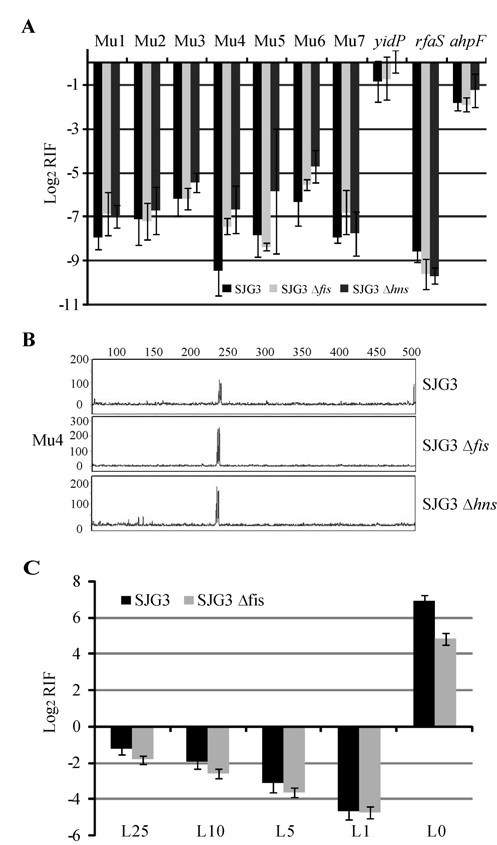
Mu insertions within Mu and flanking DNA in fis and hns mutants.(a) Data for SJG3 are from Figure 1b. All other descriptions as in Figure 1b. (b) FLA analysis of reactions for the Mu4 region. Other descriptions as in Figure 1c. (b) As in (a), except insertions were monitored in L0 to L25 regions in the indicated strains.