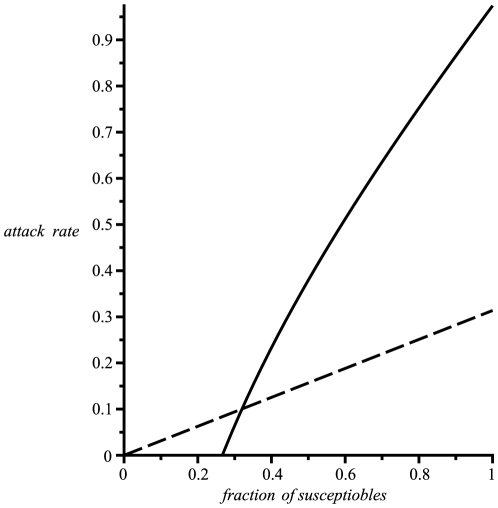
Figure 1. Attack rate as a function of the initial fraction of susceptibles.
Assuming  , the attack rate (continuous line) is plotted as a function of the initial fraction of susceptibles
  in the population. An epidemic will not trigger unless the initial susceptibles are greater than
  , due to herd immunity. The dashed line shows the naive prediction for the attack rate, obtained by extrapolating linearly from the
  attack rate for
  , which can be well below the theoretical estimate.

