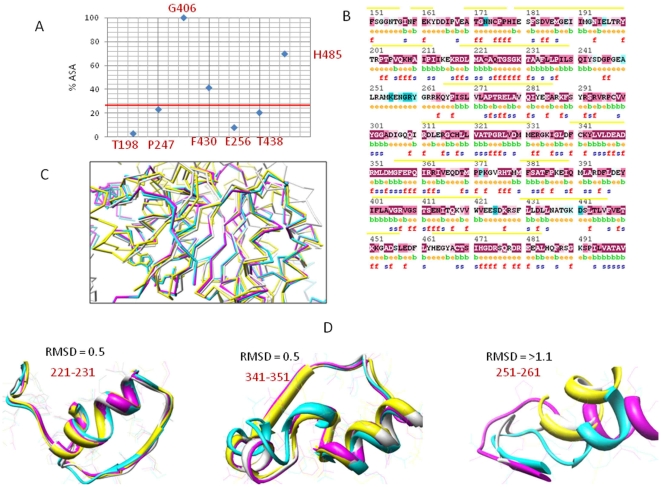
Figure 2. Functional residue identification on DDX3X.
A) Positively selected residues plotted against Accessible Surface Area (ASA) B) Residues under negative selection (yellow line) grouped into functional amino acids based on conservation scores. The numbering corresponds to amino acid positions in DDX3X. f: functional residues; s: structural residues; e: exposed; b: buried C) Graph between Root Mean Square Deviation (RMSD) and residue position represents structural alignment of DEAD box members. D) DDX3X structurally aligned with DEAD box helicases.

