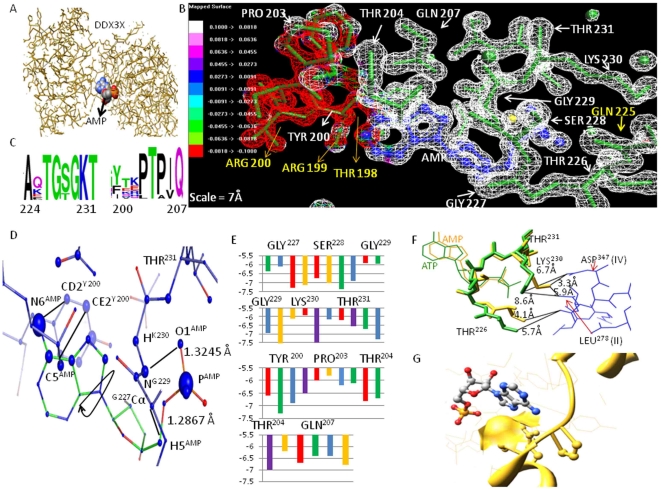
Figure 3. Functional residues at the ATP binding site of DDX3X.
A) DDX3X structure (wireframe) showing the bound AMP (sphere) at the groove formed by bilobed DDX3X. B) Electrostatic potential map showing charge distribution near essential functional residues. Red are regions of negative ESP (Electrostaic potential). White represents positive ESP C) Alignment showing entropy at each functional residue position with most conserved residues having highest bit score. D) Atomic contributions for ATP binding for functional residues. Atoms contributing maximum are shown with spheres of large radius. The inter-atomic distance are shown alongside critical ATP-DDX3X association and is given in the units of Angstroms. E) Binding energy change values on substitutions at various functional residue positions. Substitutions: red – with positive charged residues; green – with negative charged residues; blue – with polar residues; yellow – with aromatic residues and purple – with non polar residues. F) Atomic displacements on ATP-AMP conversion. Thr226, Lys230 and Thr231 occupy critical positions in contact with residues of motifs II and IV. G) Q207 and P204 occupied crucial positions in the ATP binding site of DDX3X. Q207 forms the base of this cavity while P204 helps in alpha helix torsion angle.

