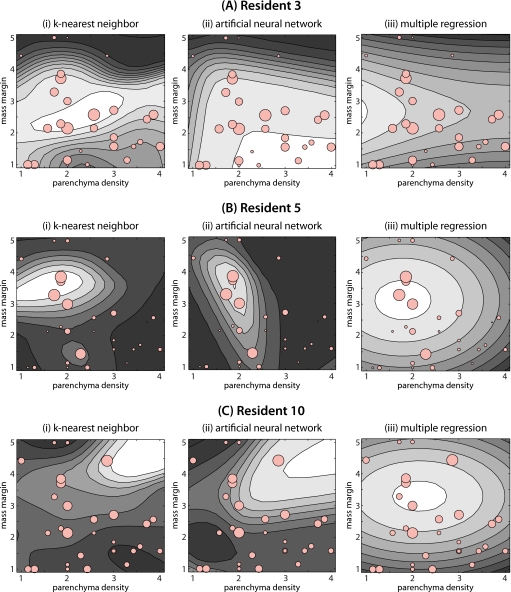
Figure 4.
Contour plots showing the users models developed by each approximation method for three different residents. Note that the models are functions of the two BI-RADS features (parenchyma density and mass margin). For mass margin the numbers represent: 1: Circumscribed, 2: Microlobulated, 3: Obscured, 4: Indistinct (ill-defined), and 5: Spiculated. For each contour plot, brighter regions indicate areas of higher predicted error. Circles show the actual errors made by the corresponding resident. The size of each circle is directly proportional to the actual error made by the resident.

