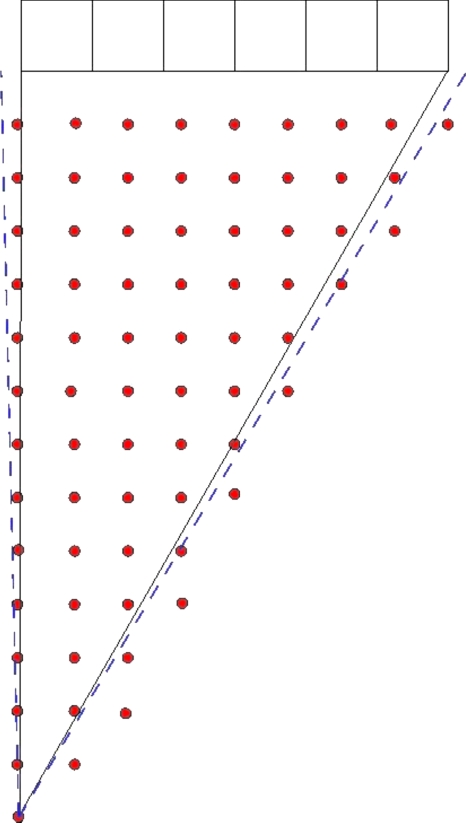
Figure 5.
(NOT TO SCALE) A schematic representation of the in-plane sampling scheme. The rows and columns of points represent sampling locations, the boxes at the top of the picture represent a block of six detectors, and the dashed lines represent inter-block gaps. The rows and columns are separated by 5 mm gaps. This pattern yielded 264 samples over the ∼350 cm2 area in the plane. This pattern was repeated at the center of the ξ planes in the positive z half of the scanner (24 planes spaced ∼3.2 mm apart).

