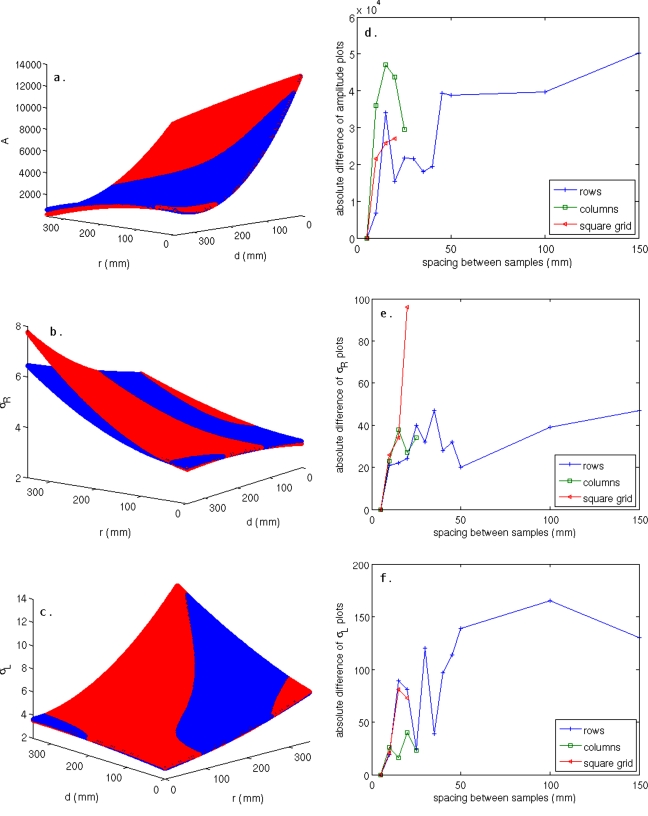
Figure 6.
Plots of the fits produced by the full data set overlaid with plots produced from a coarser data set with 5 mm column spacing and 15 mm row spacing over the range r=0–350 mm and d=0–350 mm for a point centered in the ξ=25 plane for (a) A, (b) σR, and (c) σL. Disagreement between the data sets shown is most evident in σR along the direction of increasing r. The absolute difference of the plots (a)–(c) is shown for (d) A, (e) σR, and (f) σL. In all cases, a large increase in the difference of the plots occurs as the spacing increases from 10 to 15 mm, and the differences oscillate with random changes in the fits as the sampling density decreases. This agrees with visual inspection of the plots that shows a noticeable change in the fits as the spacing goes from 10 to 15 mm.

